What’s in Nary’s Brain?
#ai4k12 #mlvisualization #onlineLearning
What’s in Nary’s Brain? is a web-based visualizer extension for Cognimates, a platform based on Scratch to help children understand AI concepts, to visualize children’s Machine Learning models and help them see how samples are clustered in 3D space.
Date Fall 2019
Toolkits Node.js, Three.js, WebDNN Resnet50, t-SNE algorithm
Platform Cognimates @ MIT Media Lab

Even though kids can train their own models in Cognimates, it’s really hard for them to understand what really happens when machine learns these models.
Why machine can recognize this photo of elephant as “Elephant” not as other animals? Why Nary, a Cognimates character, gives a happy face when we say “I love you” to her? What’s in Nary’s brain when she is learning our models?
So we visualize children’s models …

Upload your samples
Choose images for each category, and feed these images to machines as training samples. For instance, you can have three categories, “butterfly“, “elephant“ and “squirrel“ and upload sample images to each of them.

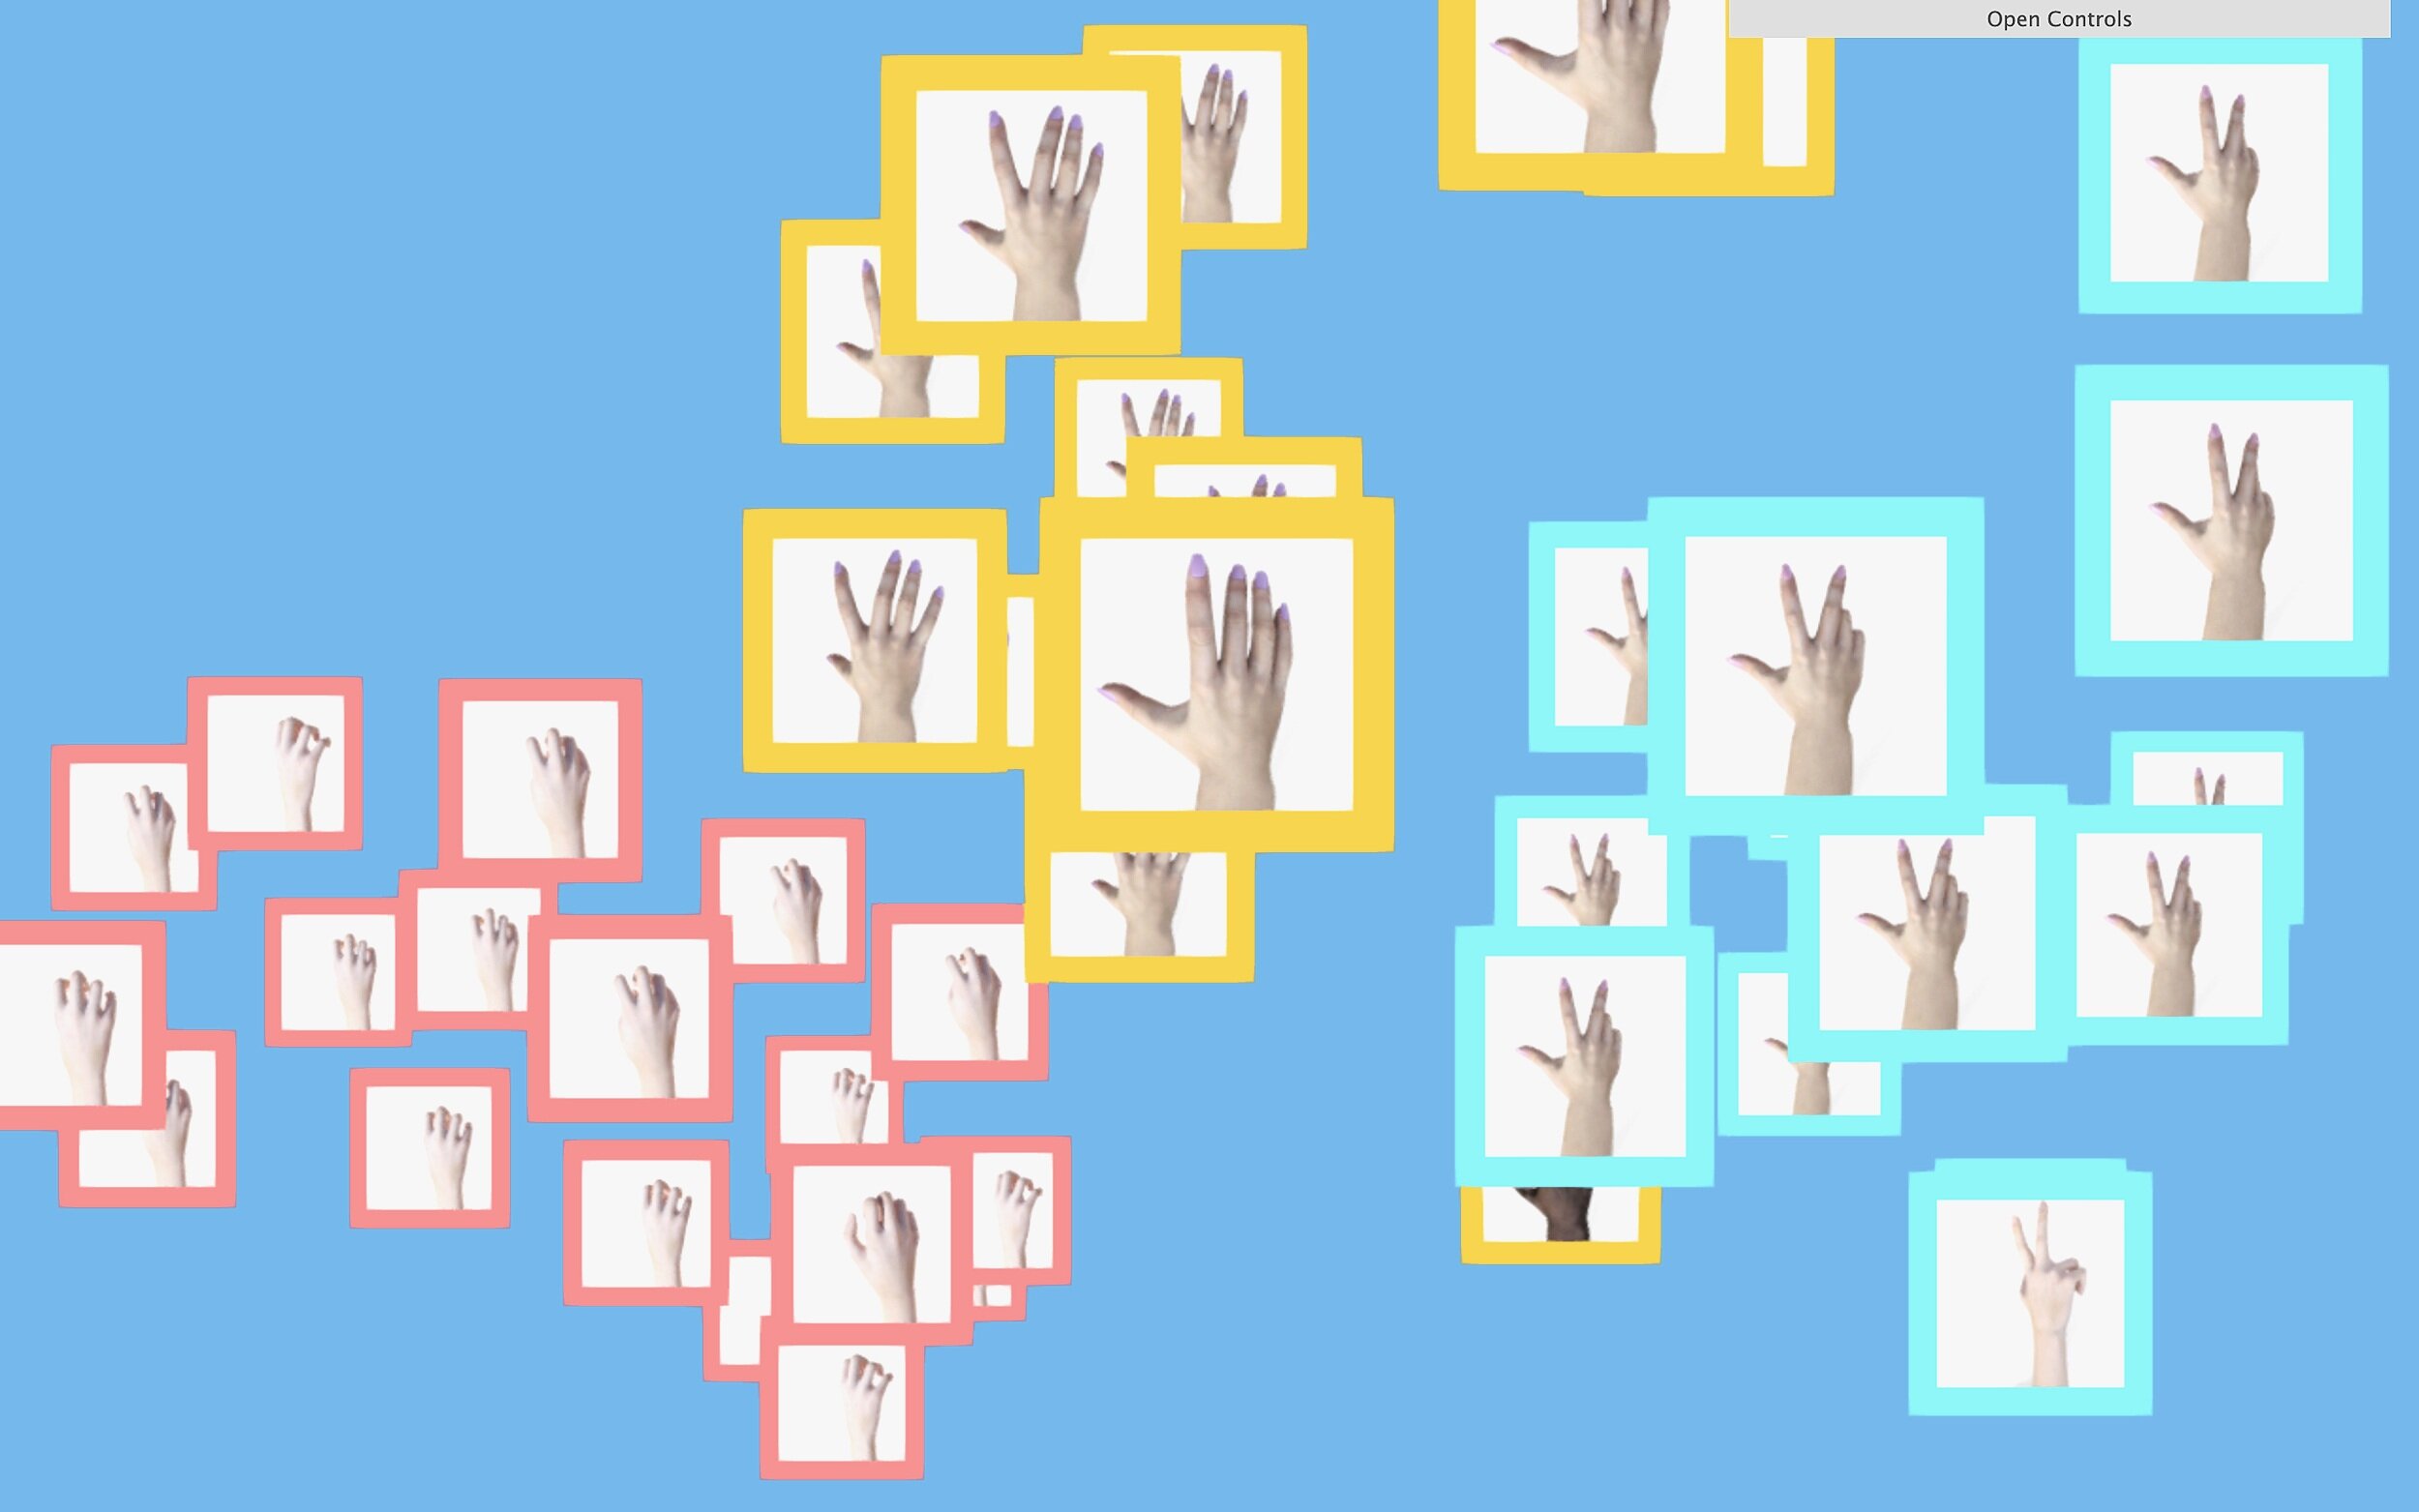
Try cool features
Switch mode to see how samples from different categories are clustered. Auto rotate to observe your model in 360 degree. Reset t-SNE parameters anytime to see how Nary interprets the model differently.

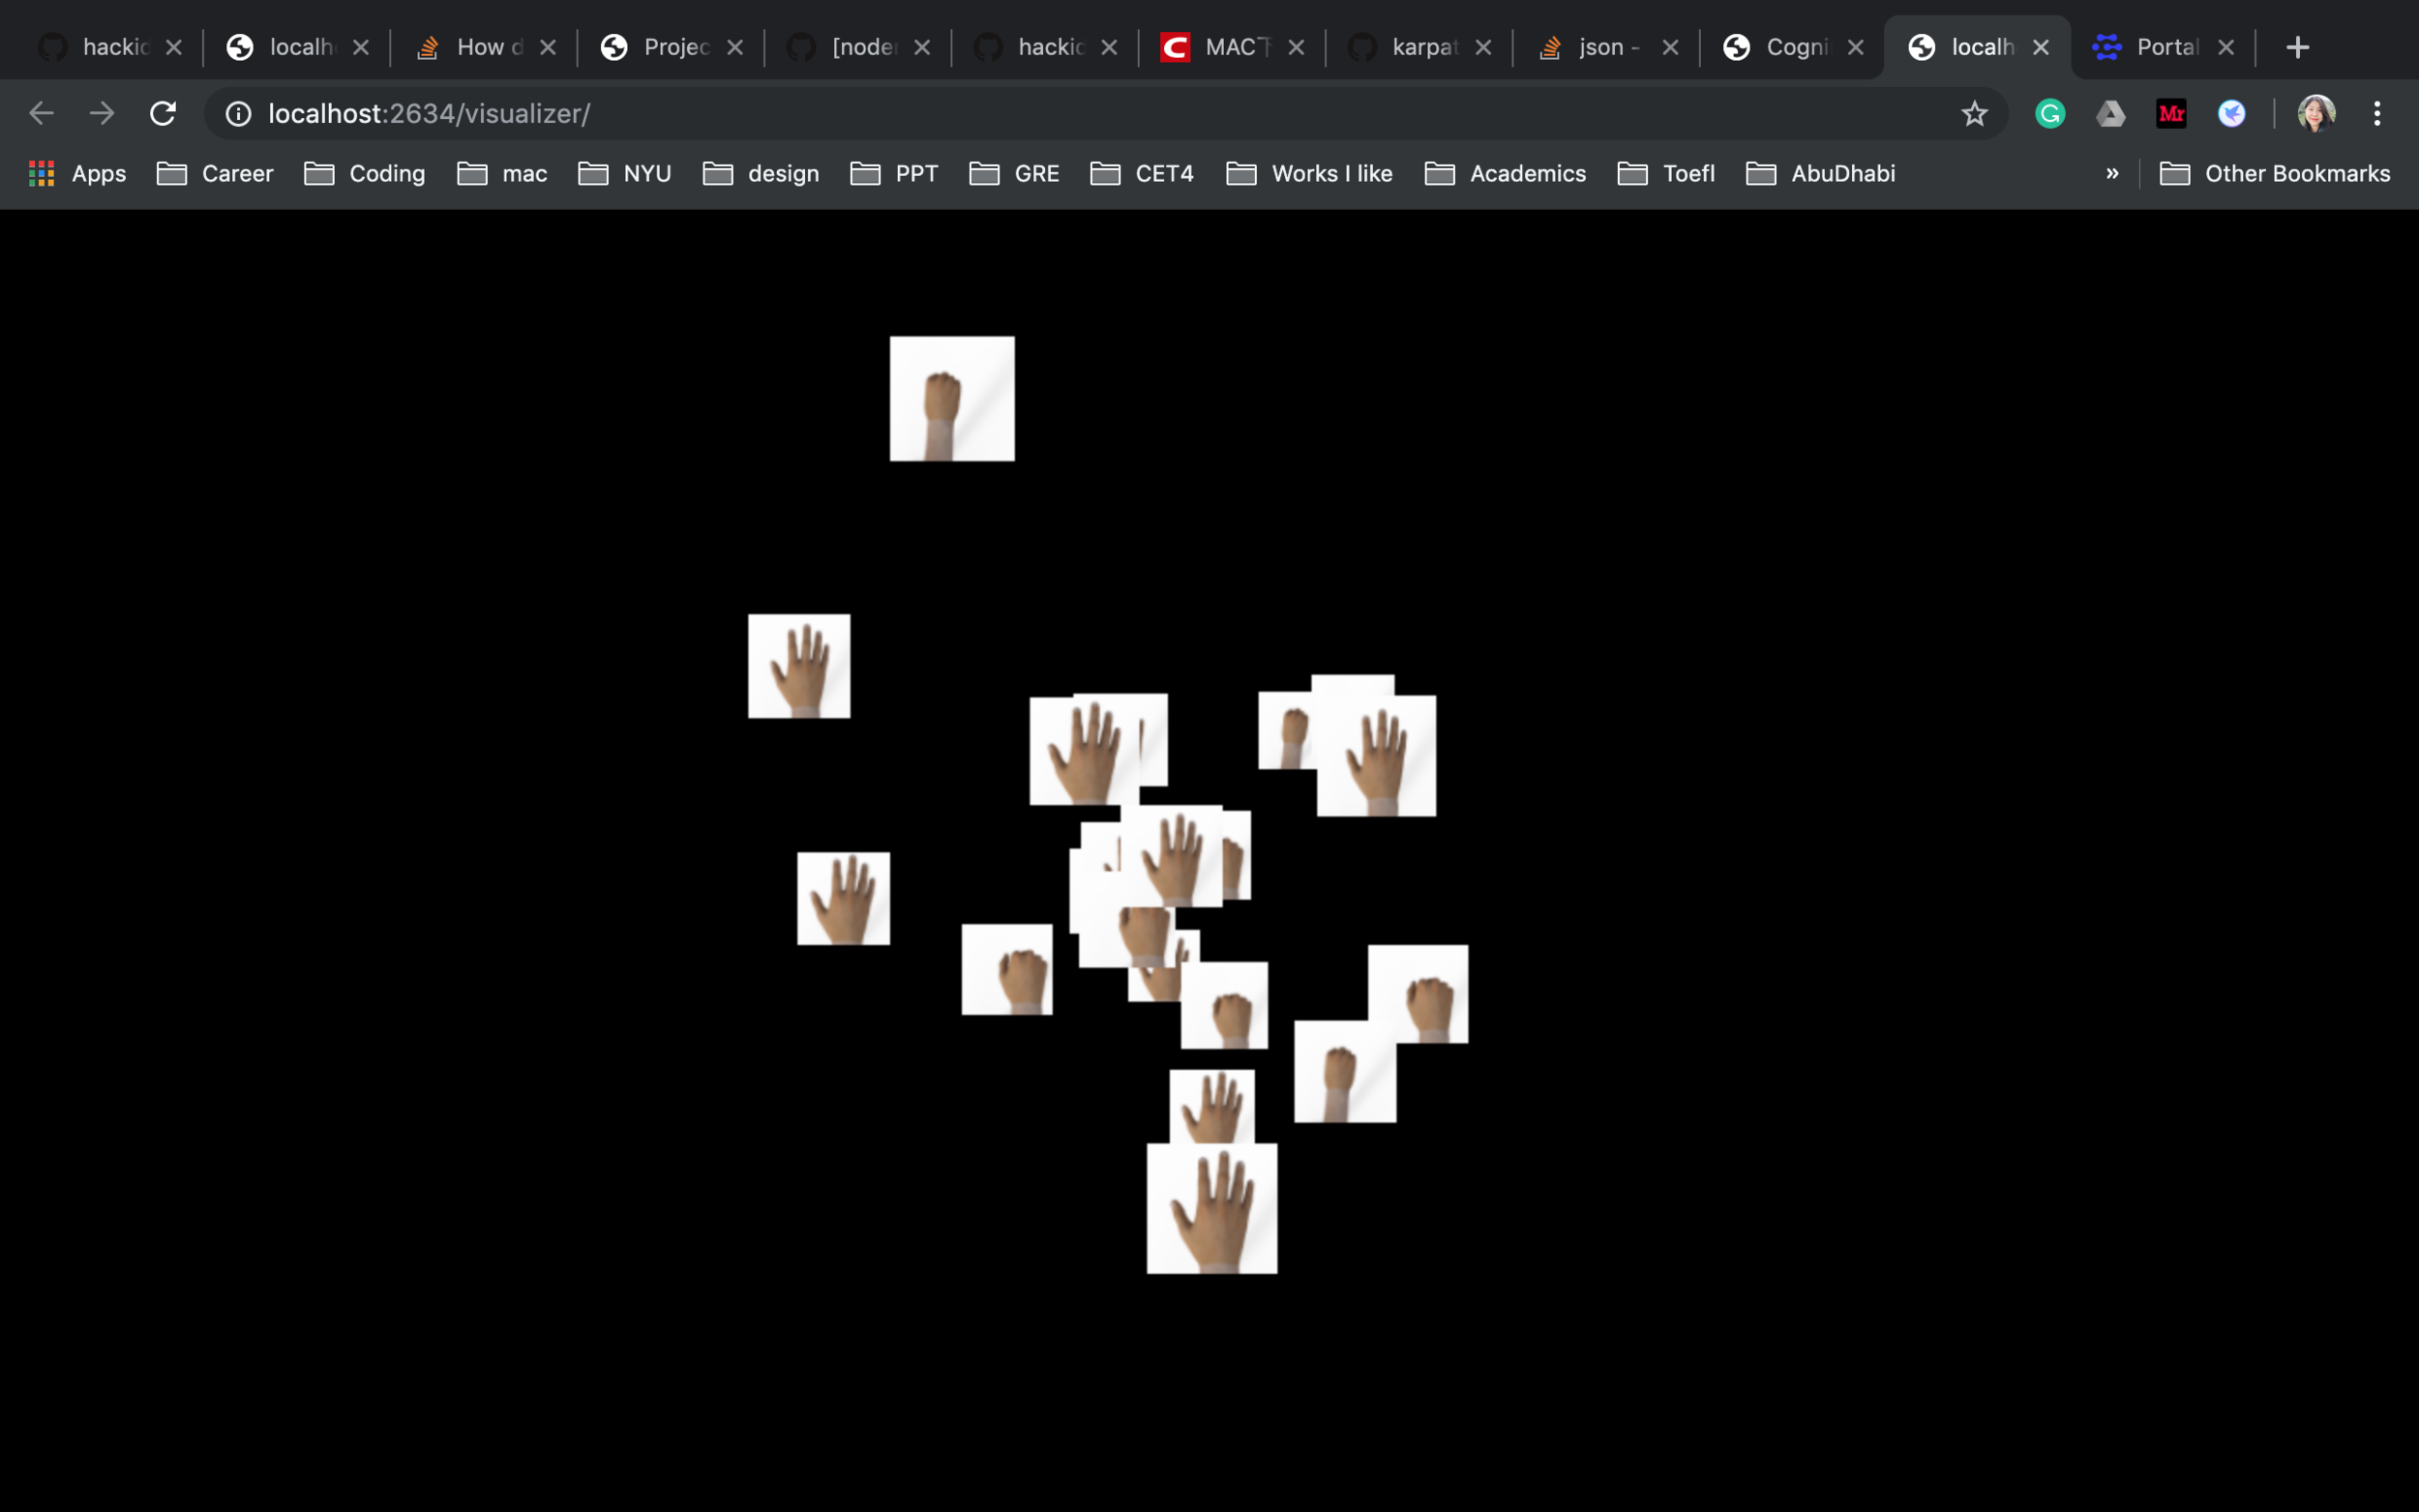
Open the visualizer
After you train your model with your samples, scroll down to check your model visualization.

Observe the clusters
You can see samples gather together step by step and form clusters. Similar samples are placed near each other. The closer these samples are, the more similar Nary thinks they are.

Explore your model
Follow the instructions to explore your model in 3D space. Scroll to zoom in/out. Drag to change the view. For each of the sample, high dimensional feature date is captured and converted to a x-y-z position.

Debug your model
Category frame mode helps you identify samples that are in the wrong cluster. Hover to check the top predictions Nary has made, and replace samples with new images.
What’s in Nary’s Brain will be deployed at Cognimates vision training module soon …

Research & Approach
Prototype it.
Create an openFrameworks-based prototype for the visualizer, and test dimensionality reduction algorithms, image feature extraction models and user interface design.
Encode it.
Fetch uses’ uploaded images data and convert the images to base64 data for feature extraction. The visualizer is attached to each query of the user and receives data from the vision training module.
Vectorize it.
Use WebDNN Resnet50 Image to extract features and vectorize the images. The result of each image will be a 1000-dimension vector. The visualizer will send request to WebDNN and get the output of the pre-trained Keras model.
Reduce it.
Use t-SNE algorithm to convert the high-dimensional vector representations of the images to 3 dimensions. Compared to PCA, t-SNE performances better in image processing tasks.
Visualize it.
Use Three.js to position each sample into the 3D space with billboarding techniques. Add features including frame modes for cluster recognition, t-SNE parameters adjustment for debug and label hovers for predictions comparison.